
Satellites keeping an eye on the vegetation of the Himalayas, responding to changing seasons with reviving grasslands, deepening colour of forests, and flora of valleys altering, reveal a story of climate sensitivity, seasonal resilience, and growing concern.

Mountain ecosystems are particularly sensitive to climate change, which exacerbates global risks and disasters. Climate change significantly affects global average surface temperatures, alters precipitation patterns, and influences vegetation dynamics, underscoring the importance of localised monitoring at various spatial and temporal scales.
Google Earth Engine (GEE)¸ a global platform that processes vast amounts of satellite data, is widely used for environmental monitoring and Earth observation, including studies of land degradation, soil and dust dynamics, urban growth, temperature changes, and health. It simplifies large-scale analysis by reducing data preprocessing and storage needs.
Researchers from the Aryabhatta Research Institute of Observational Sciences (ARIES), Nainital, an autonomous institute of the Department of Science and Technology (DST), along with collaborators from India and abroad, turned to GEE to track Uttarakhand’s vegetation from 2001 to 2022, along with pollution and climate responses.
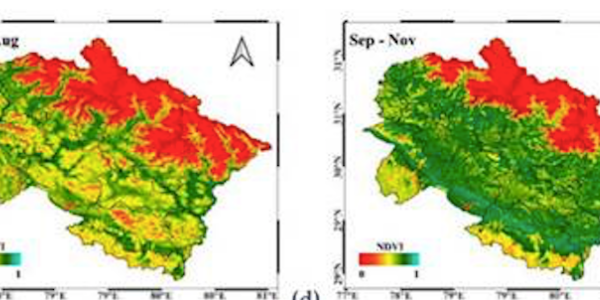
They used a deceptively simple measurement, the Normalized Difference Vegetation Index (NDVI), to analyse changes in vegetation.
The results of the research by the team led by Dr Umesh Dumka from ARIES, along with international collaborators, published in Environmental Monitoring and Assessment (a Springer Nature Publication), revealed a story of climate sensitivity, seasonal resilience, and growing concern.
Lower values of NDVI correspond to barren areas, such as rock, sand, water, exposed soils, or snow, while higher NDVI values indicate dense green vegetation, including forests, croplands, and wetlands.
The study also analyzed EVI (Enhanced Vegetation Index; similar to NDVI but with improved sensitivity in high-biomass areas) and climate variables and their relationships in Uttarakhand, northern India.The spatial and time-series plots generated via GEE were employed to analyse changes and trends across the study area, while Pearson’s correlation assessed the effects of climate variables on NDVI and EVI. The results show that NDVI and EVI are highest after the monsoon and lowest before it, with clear monthly, seasonal, and yearly variations. Over the last two decades, the natural rhythms have begun to shift.
The researchers observed declining vegetation trends, linked to deforestation, agricultural expansion, illegal logging, and increasing pollution from urban and industrial sources. The data suggest that pollution doesn’t affect vegetation uniformly—it hits certain locations harder, compounding the stress caused by climate change
These changes threaten biodiversity, water resources, and the natural balance that millions of people downstream depend on.
The study shows that modern satellite science can act as an early-warning system, helping policymakers and communities understand where intervention is most urgently needed.


